Understanding the Match Scout report
The Scout report provides a deep statistical analysis of one specific match. Everything you need to make an informed decision is here.
The report header
At the top of the report you see the club logos of the home and away teams, date, time and competition, and value chips summarising the edge per market.
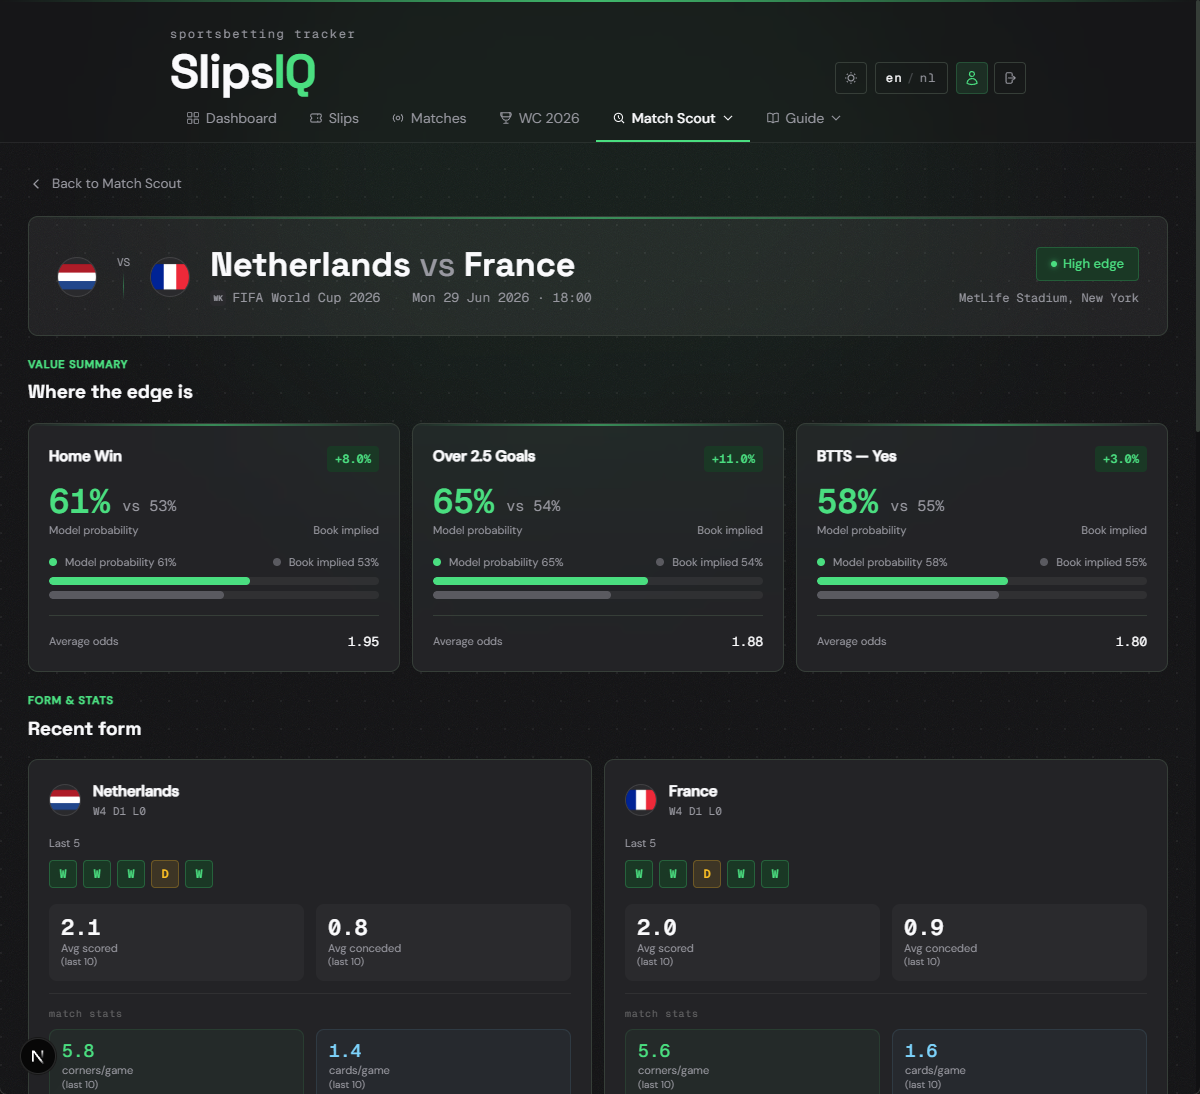
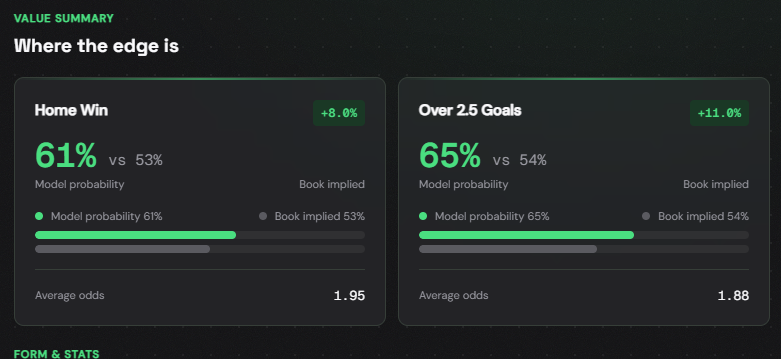
Value cards
Each value card shows for one market: the recommended side (e.g. Home win or Over 2.5), the edge as a percentage, your Poisson-calculated probability, and the bookmaker's implied probability.
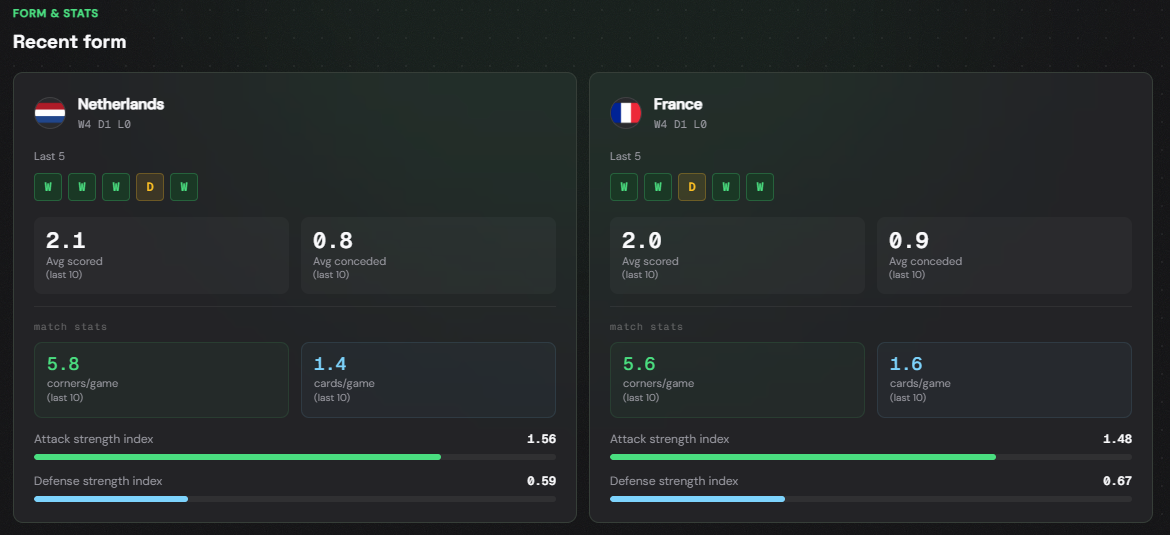
Team form
The form section shows for each team the last 5 matches (colour-coded green/yellow/red), average goals scored per match, and average goals conceded per match.
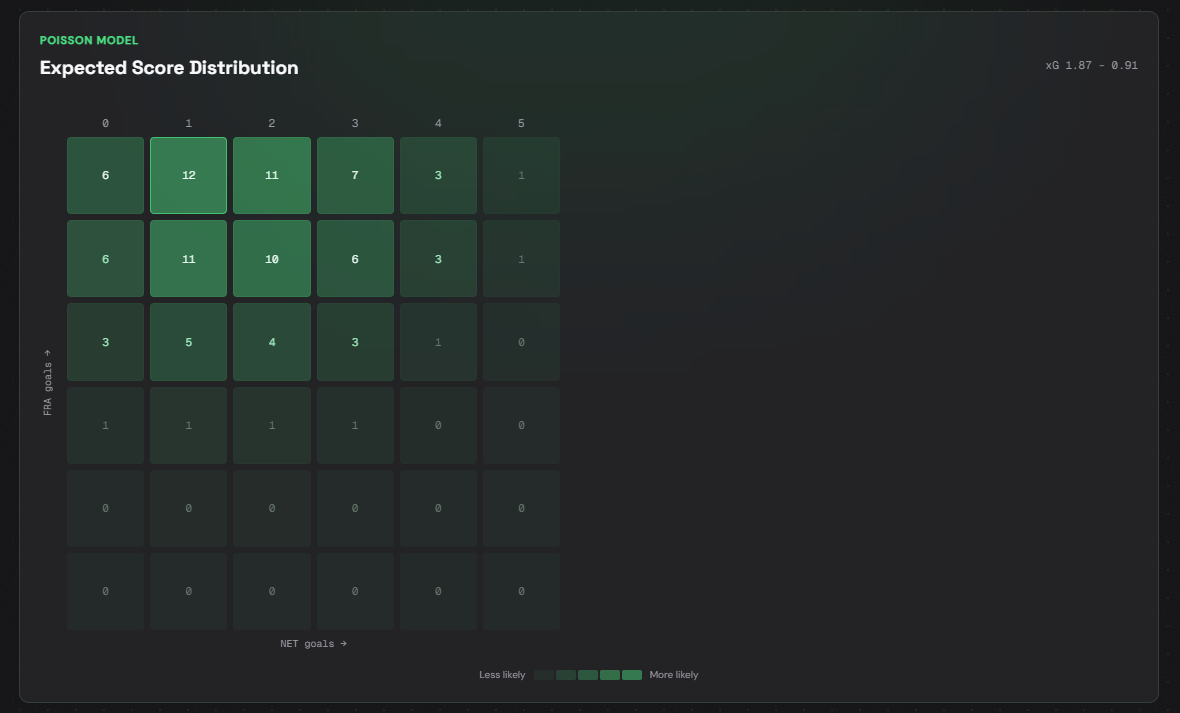
Goals probability heatmap (Poisson)
The heatmap shows the theoretical probability of each scoreline from 0 to 5 for both teams, calculated using the Poisson model. Dark means high probability, light or empty means low probability.
AI summary and H2H
The AI summary generates a concise analysis based on all available data: strengths and weaknesses per team, key statistical signals, and market recommendations. Click Generate analysis to load it.
The H2H section shows the historical match results between the two teams: date, competition, final score, and winner.
How to use the report
Check the value cards — is there a market with clear edge?
Check the team form — is the form consistent or erratic?
Read the heatmap — which scorelines are most likely?
Read the H2H — what is the historical trend between these teams?
Read the AI summary as a quick check of whether your conclusions hold.
No model predicts the future. Use this report as input for your decision, not as a guarantee.
Frequently asked questions
The Poisson model is a mathematical method for estimating the expected number of goals based on the attacking and defensive strength of both teams. It is a standard technique in sports statistics.
Bookmakers adjust their odds based on market movements and their own assessments. The Poisson model looks purely at historical statistics, so there will always be small differences.
Not directly from the report. Go to the Slips page and add the match manually as a leg. A future version may make this faster.